ON.Dispensing
With near‑real‑time visibility into in‑office dispensing and refill behavior, you can understand adoption trends, monitor competitive dynamics and inform strategic planning based on what’s happening in practice.
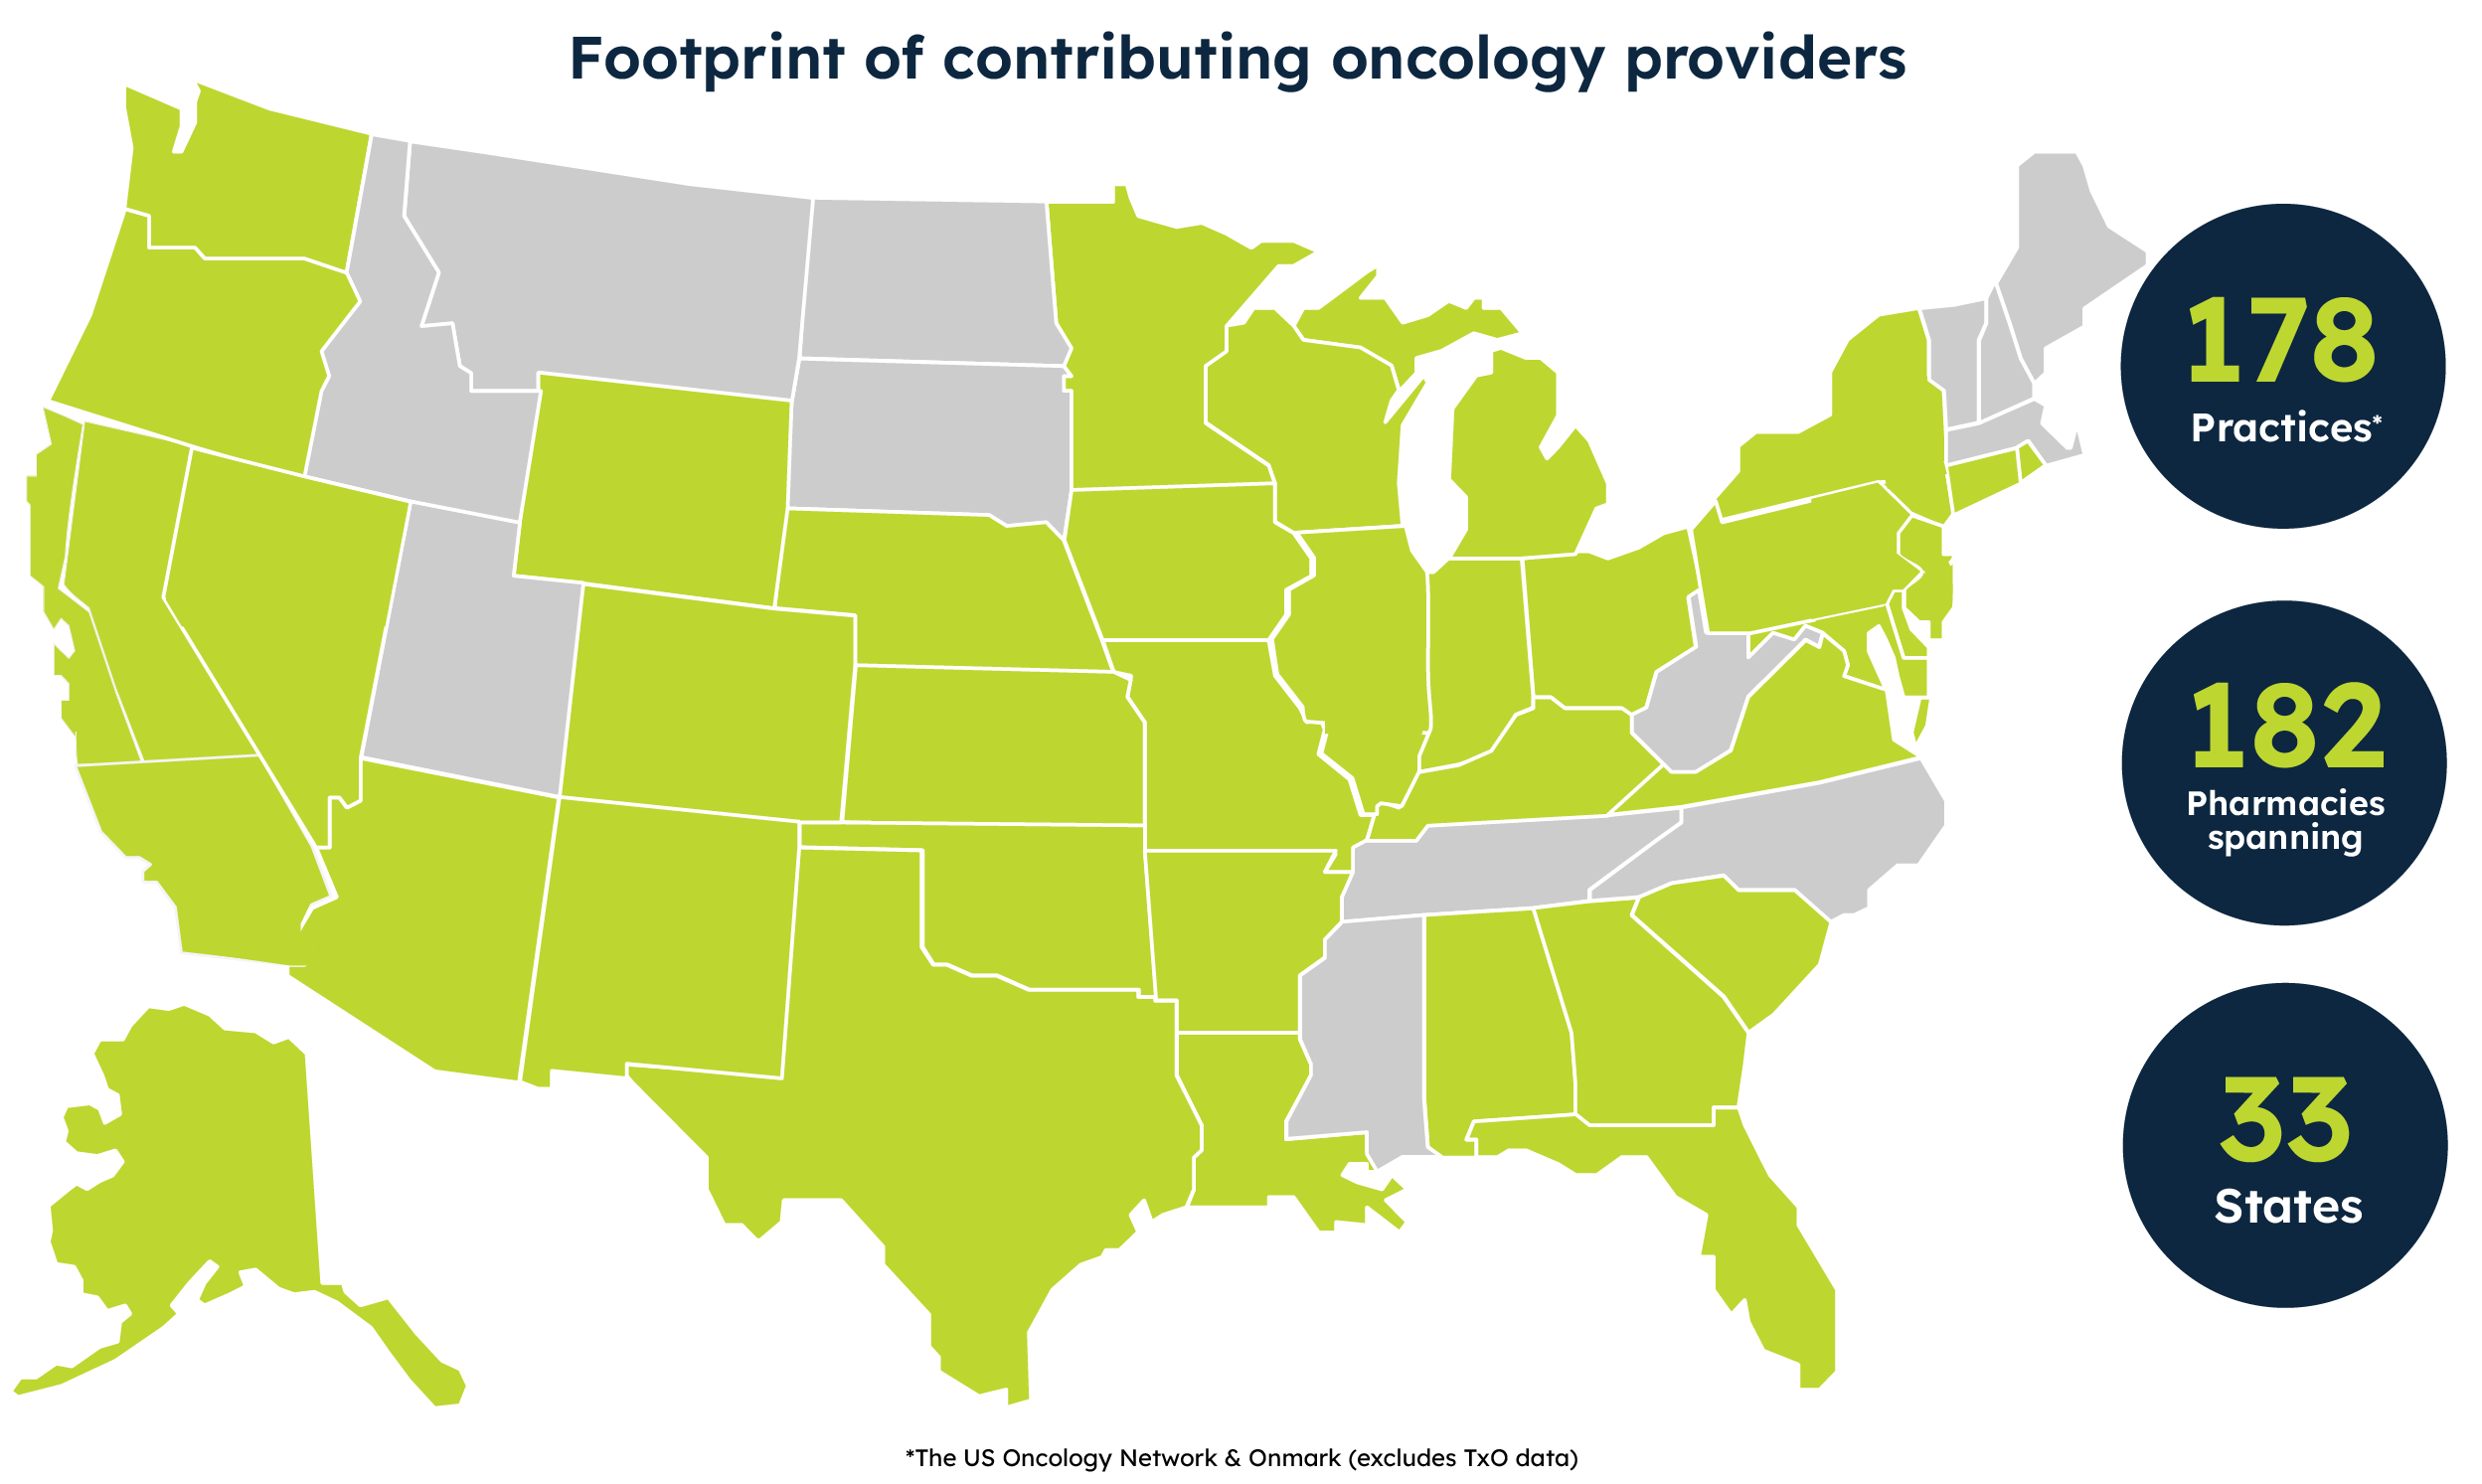
Ontada’s dispensing data now includes data from Florida Cancer Specialists & Research Institute (FCS) — part of The US Oncology Network (The Network) — for one of the most comprehensive views of oral oncology dispensing available in a single solution.

Why ON.Dispensing data gives you confidence to act
Know where dispensing data is available to support internal analysis and planning
Includes in-office dispensing data from FCS and other community oncology practices within The Network
Understand how your oral therapy is being dispensed in the community setting so you can understand adoption trends, assess competitive dynamics and refine planning assumptions.
See how dispensing activity and payer mix intersect in real-world practice to identify emerging access barriers and support more informed access strategies.
Use timely visibility into in-office dispensing and refill behavior to understand emerging trends, support internal planning and reduce lag between activity and insight generation.
Work with granular, longitudinal dispensing data that supports forecasting, segmentation and performance analysis grounded in real treatment activity.
Support evidence-based discussions with stakeholders using real-world insight into how oral oncology therapies are being used and sustained in community practices.

Which strategic questions can ON.Dispensing help you answer?
Adoption signals
Which oral oncology therapies are being dispensed in community practices, and how quickly is real‑world adoption taking hold?
Competitive dynamics
How does your brand’s in‑office dispensing activity compare to competitors within the same class, and where are shifts happening?
Refill behavior
What do refill and continuation patterns reveal about persistence and potential adherence challenges in the nation’s largest community oncology network?
Market share trends
Where are you gaining or losing share, and how do those trends vary by region, practice type, or product lifecycle stage?
Access insights
How do payer mix and reimbursement patterns intersect with in‑office dispensing activity to influence treatment continuation?
Patient visibility
Where are gaps emerging between prescription intent and ongoing treatment, and what signals indicate the need to respond?
How ON.Dispensing supports decisions across the brand lifecycle
- Establish baseline dispensing patterns within the treatment landscape
- Identify early adoption signals and competitive dynamics to inform launch planning assumptions
- Confirm real‑world uptake through in‑office dispensing activity as it emerges
- Monitor early refill behavior to better understand emerging patterns
- Evaluate persistence and continuation trends to surface adherence‑related risk
- Track competitive shifts and market share changes to support ongoing analysis and planning
Yes, the data includes aggregated, compliant physician‑level analytics for oral oncology therapies dispensed in‑office, allowing you to analyze treatment activity for analytical purposes only.
Data is refreshed weekly to reflect recent in-office dispensing activity, helping you identify changes in adoption and refill behavior without long reporting delays.
The dataset draws from a broad and growing base of community oncology practices, offering real-world visibility into how oral therapies are dispensed and continued in routine care.
The dataset reflects dispensing activity across a broad range of community oncology practices, including data from FCS and The Network.
You can analyze adoption, refill behavior and dispensing trends by brand, practice or geography. Common use cases include understanding competitive dynamics, monitoring continuation and evaluating market performance over time.
Yes, the data supports competitive analysis by showing relative dispensing activity and market share trends within oral oncology.
Yes, from establishing pre‑launch baselines to monitoring persistence and competitive shifts after launch, the data supports more informed decision‑making across the brand lifecycle.
Ready to better understand what’s happening with oral oncology treatment in the community setting? Connect with an Ontada expert to explore how in‑office dispensing and refill insights can support more confident decisions across your brand lifecycle.